First, it appears that this analysis is based on the assumption that the Colts' footballs were gauged right after the Patriots' footballs. I refer to PDF page 162 (p.2 of the Exponent report)
According to information provided by Paul, Weiss, during the halftime period, three events pertaining to the footballs are known to have occurred:I'm very suspicious of this need to make an assumption. Here are things we know. 1. The Patriots' balls were tested first. 2. The stated excuse for only testing four Colts' balls is "we ran out of time", 3. Between the two sets of tests, Prioleau and Blakeman switched gauges.
1. The air pressure measurements of 11 Patriots footballs were taken and recorded.
2. The air pressure measurements of four Colts footballs were taken and recorded.
3. The reinflation and regauging of 11 Patriots footballs to a level within the 12.5–13.5 psig range was performed.
According to information provided by Paul, Weiss, it is clear that of the three events listed above, the measuring of the Patriots balls occurred first. Although there remains some uncertainty about the exact order and timing of the other two events, it appears likely the reinflation and regauging occurred last. According to security footage, the footballs were taken back to the field for the second half at approximately 8:42:30 pm, meaning that they were inside the Officials Locker Room for no more than 13 minutes and 30 seconds. Therefore, all three of the above listed events must have taken no longer than 13.5 minutes to complete.
I would argue that it's much more likely that they switched gauges if the reinflation and regauging of the Patriots' footballs took place before the Colts' balls were tested. In this scenario, the gauges are put down and the pumps are taken out to reinflate the balls that are all arrayed around the room. The officials have emptied a bag of footballs, it seems more likely that they'd want to fill that bag again before emptying the other bag - for a good number of reasons. I'm very hard-pressed to imagine the opposite scenario, the one that Exponent claims is more likely: With 11 balls lying around the room, how likely is it that somebody looks at his watch and says "It will take an indeterminate amount of time to reinflate and gauge these balls. But I'm pretty sure we only have time to gauge four of them. Let's start that process, abort it 1/3 of the way through, and then return to the Patriots' footballs." It's a nonsensical scene.
I would also argue that if this point were important, and it were true that the Colts' balls were done in the middle, that it would be easily confirmed. I am not buying into "there remains some uncertainty about the order of events." You had a room full of people and none of them can remember if the Colts' balls were tested before or after the Patriots' balls were reinflated? Given that the excuse for not doing all the Colts' footballs was "We ran out of time," I think we already have solid information that this part of the halftime procedure was last. But like Walt Anderson's recollection about which gauge was used before the game started, a recollection that supports the Patriots' case is discarded.
So, let's look at what the air pressures actually were. At some point I might address the rest of the Exponent report, but let's just say that they do a whole lot of simulations, apparently with the theory that if you don't have actual data, you should replace it with simulations. Huzzah!
We'll start with the pre-game pressures. Wait - we can't actually start with the pre-game pressures, because they were never recorded. We'll start with the halftime measurements. There were two gauges, one used by Prioleau and one by Blakeman. The table of values is
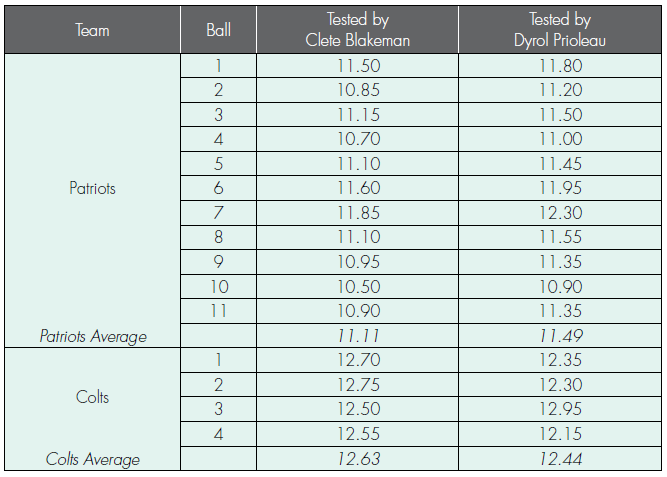
Note the curious fact that, for the Patriots' balls, all the Prioleau measurements are 0.3 - 0.45 psi higher than those for the Blakeman measurements. For three of the Colts' balls, #1, 2, and 4, the opposite is true. For ball #3, the opposite is true: Ball #3 is higher.
Exponent has done a lot of measurements with these gauges and it's pretty clear that the gauge with the Wilson logo is consistently about 0.35-0.4 psi higher than the one without the logo. So it's likely the officials switched gauges between the two sets of measurements. They argue that ball #3 implies two more switches, and they produce the following table:

I don't think it's reasonable to switch the values for Ball #3. I can see one swap of gauges, between the two sets of balls, esp. if something happened in between (re-pressurizing and gauging the Pats' footballs). I cannot see doing so solely for one ball, esp. at a point when the officials were pressed for time. Seems more likely that the 12.95 is simply a data entry error. If the 12.5 is a correct measurement for the logo gauge, what would the measurement for the other gauge be? Probably between 12.05 and 12.2. And 12.05 could easily be misread as 12.95.
The suggested 12.95 measurement is ridiculous, unless we throw out one of the assumptions that Exponent is relying on. It's just not enough pressure loss for a ball that started at 13.0-13.1 psi before the game started.
So what, exactly, should we expect the ball pressures to be? At this point we should look at the gas laws. Exponent doesn't, except briefly. There are many gas laws relating the pressure, temperature, volume, and mass (or number of molecules) of an amount of air enclosed in a bladder. They are collectively referred to as either the Combined Gas law or the Ideal Gas Law.
The basic law is PV = nRT, where P is the pressure of the gas, V is the volume, n is the number of moles (i.e. the amount of the gas), R is a constant, and T is the temperature (in Kelvin).
We are going to dismiss two of these variables. We assume no leaking, so n is constant. And we assume that the footballs are sufficiently rigid to neither expand nor contract. This isn't true in an absolute sense, but for the range of pressures we'll consider, it seems reasonable. I'll change the constant to k=nR/V, and this means we're looking at P = kT. (This particular restriction of the gas law is known as Gay-Lussac's Law).
Let's let P1 and T1 be the pressure and temperature before the game, and P2 and T2 be the pressure and temperature at halftime. Then k = T1/P1 = T2/P2, though the Exponent report uses the equivalent reciprocals: P1/T1 = P2/T2.
Table 10 provides some expectations of what the values should be, for various starting pressures and temperatures.

We assume that the temperature in the officials' locker room pre-game was between 70F and 75F. The onfield temperature was 48F.
Based on this table, if the balls were at 12.5 psi before the game, they should be at 11.13 coming in off the field. Notice that the two values from the table above are 11.49 and 11.19 psi. Based on the Ideal Gas law, neither figure is suspicious at all. And the best recollection of referee Walt Anderson is that he used the logo gauge before the game, which would use the 11.49 number.
Now let's consider the Colts' footballs. The report says that most were in the range from 13.0-13.1 psi. As is their wont, Exponent chooses the lower number. If we use the same starting and ending temperatures, then we'll look at the 2nd row from the bottom. The Colts' balls, which started at 13.0 psi, should be at 11.6 psi at halftime. Instead, they are at 12.33 or 12.74 psi.
The Colts' balls are way too high! What's going on here? A couple things. For starters, the data fudging on the Colts' side makes the "average" psi dubious. I will instead use 12.5 for the logo gauge and 12.05 for the non-logo gauge. In that case, the average Colts pressures are 12.63 for the logo gauge and 12.21 for the non-logo gauge. Still, the data from the logo gauge suggest that the Colts' balls only lost 0.37 psi.
What's going is the footballs warmed up while the Pats' footballs were being measured. And then they warmed up more while the Pats' balls were being re-inflated and gauged. I put together a small Excel spreadsheet to calculate final pressure based on initial pressure and the two temperatures.
Let's refer back to the gas law and see what temperature would lead to a measurement of 12.63 or 12.21 psi.
Let's see..to get from 13.0 to 12.21 psi, the temperature of the air in the Colts' footballs at halftime had to be about 60F. To get to 12.63 psi, the temperature would have had to be 68F. Look, this is the gas law here. For the balls to be as inflated as they were, the contents had to be much warmer than the contents of the Patriots' footballs.
Is this possible? Actually, it is. Again, based on Exponent's own work:
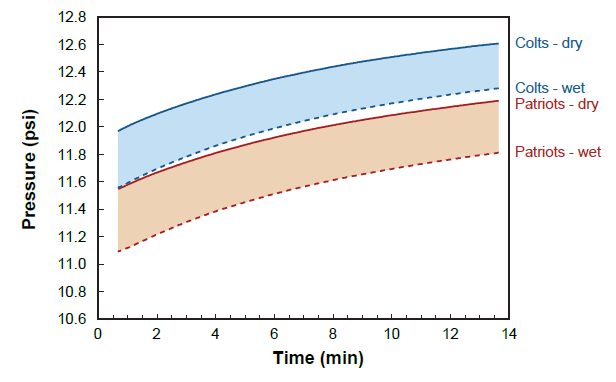
Consider Figure 21. This shows how quickly the balls regained more air pressure depending on how long they were in the locker room.

Wet balls take longer to warm up fully for some reason. But we are told by WellReportContext.com that, since the Patriots dominated time of possession in the first half, their footballs were wetter. Also, the Colts' footballs were stored in plastic trash bags, while the Colts' footballs were not.
Figure 22 zooms in:

We see that the observed pressures for the Patriots are what we would expect for testing in the first few minutes after the balls were brought inside.
Figure 24 looks at specific balls being tested, if initial pressures had been tested by the non-logo gauge.

Figure 26 looks at what to be expected if the initial gauge was the logo gauge
We see the Pats' pressures stay under 11.5 for roughly the first 5-6 minutes. The wet balls stay in that range even longer.
Then there's this figure, Figure 27, which is puzzling.
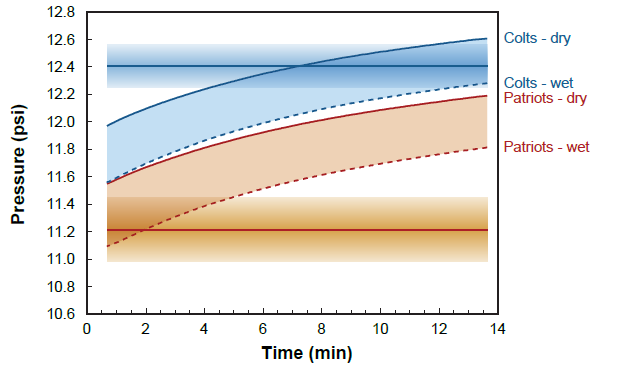
"We can further refine this construct by overlaying a representation of the average pressures
observed on Game Day for each team, as measured by the Non-Logo Gauge. The result of this is
shown in Figure 27." (Actually that text was before Figure 25, but Figure 27 was made along the same line of reasoning.) The problem is that have centered the two bands at 12.4 and 11.2 psi, respectively. Why have they done this? They have averaged the measurements from both gauges, for some reason that escapes me. Hmm....they seem to be mixing a bunch of different issues together. Rather than simply do one analysis with one gauge only, and a second analysis with the other gauge only, they've tried to convert the gauge data to a value of what the pressure "really was". This conversion takes several pages of using a far more accurate pressure gauge to relate these two pressure gauges and a handful of other gauges of identical manufacture. This whole process implies a degree of certainty that just isn't supported by the chaos of the measurement protocol. Regardless, there are several minutes of overlap that would explain why the measurements are in the range they are.
Let me do it a bit differently. Let's say that the Pats' footballs were at 12.5 psi before the game started. If the locker room was at 74F, then we would expect to see them at 11.17 psi at halftime at 48F, a value below even the non-logo gauge. If the locker room were at 71, then we would expect to see them at 11.32 psi at halftime at 48F. The report says the thermostat was set to between 71 and 74. If I split the difference and start at 72.5 F, the balls should be at 11.24 psi. They can warm up to 53F and still be at 11.50 psi, which is roughly where they are in the measurements. And let's not forget that this would be the average pressure, which would mean that since half of the measurements come before the median measurement, the process could continue while the balls warmed up even further for a couple minutes.
The transient curves above have another flaw. They did not replicate the conditions of the locker room. They brought two footballs at each pressure level into a warmer room and started the process of warming them up. Such a situation represents the fastest possible warming situation. In reality, each set of balls was in a bag, filled with colder air and cold footballs. When a cold football is surrounded by other cold footballs, it will not warm up as quickly. (Similarly, a 10-foot tall snowbank will take longer to melt than a snowball in isolation.) Again, Exponent feigns a degree of precision that simply isn't possible.
But that's the general problem here. Exponent is basing an analysis on what an expected ball pressure should be with two flawed, highly different gauges, a lack of initial measurements, obvious recording errors, measurement fluctuations, and zero data about what the temperatures were. Even with all of that in play, Exponent still could not dismiss the possibility that the footballs were at a pressure significantly different from where they should be as expected by the Ideal Gas Law.
OK, let's see what WellsReportContext.com has to say about this.I'll point you directly to the statement of Robert McKinnon, Nobel Laureate. He's also a business partner of Robert Kraft in at least one venture, but that fact doesn't change the validity of his science. (I have studiously avoided making any ad hominem attack on Exponent. Actually, for the most part their work is very good.)
This level of precision and accuracy in recollected numbers seems unlikely if you look at data that were actually recorded in writing. Let me give two examples. First, take the ball intercepted by the Colts. The pressure was measured three times on this same ball and the numbers are 11.35, 11.45 and 11.75 psi. As anyone can see, these values vary quite a bit.
Second, the Ideal Gas Law predicts that pressure should systematically increase over time when the balls were brought from the cold field to the warm locker room at halftime, as pointed out in the Wells Report. However, I do not see this systematic change in the sequential measurements of 11 Patriots balls and 4 Colts balls.I would add that the lack of an increasing trend among the Patriots' measurements would suggest that they were done fairly quickly. Look at the transient curves! If measurements had taken several minutes, we would have seen temperatures increasing and pressures increasing. But no increasing trend is visible among the Patriots' footballs. Indeed, the average pressures of the last four balls tested are lower than the average pressures of the first four balls tested, for each gauge.
The pressure in each ball must increase as it warms, but the systematic trend within the data this would produce is apparently obscured by a large measurement error – the kind of measurement error you see in the example of the ball intercepted by the Colts, a case in which the pressure was measured three times.Well said, Professor MacKinnon. I'll cut and paste his conclusion.
In summary I believe the data available on ball pressures can be explained on the basis of physical law, without manipulation. The scientific analysis in the Wells Report was a good attempt to seek the truth, however, it was based on data that are simply insufficient. In experimental science to reach a meaningful conclusion we make measurements multiple times under well-defined physical conditions. This is how we deal with the error or ‘spread’ of measured values. In the pressure measurements physical conditions were not very well-defined and major uncertainties, such as which gauge was used in pre-game measurements, affect conclusions. Finally, the claim of a statistically significant difference in pressure drop between the two team balls regardless of which gauge was used did not account for the fact that the Colts balls were apparently measured at the end of halftime since the officials ran out of time and made only four measurements – in other words, the Colts balls were measured after the Patriots balls and had warmed up more. For the above reasons, the Wells Report conclusion that physical law cannot explain the pressures is incorrect.Yes, I find the claim that there's some minuscule p-value here to be particularly unsupportable. You simply cannot have so many uncontrolled variables: an unrecorded choice of initial gauge, unrecorded initial pressures, lack of in-ball temperature measurements, gauges switching from one official to the other at halftime, no record of exactly when the halftime measurements were taken, and, possibly worst of all, an obvious error in recording or transcribing data, and pretend that you have a precise p-value. And the only calculation of p-value was based on the difference between the two sets of observed recorded, a difference most likely due to the passage of time in the locker room at halftime. How Exponent dismisses this concern is not something I understand.
No comments:
Post a Comment